Cheat sheet: understanding the pmap(1) output
pmap(1) can be used to list the individual address areas which are mapped into a process. It essentially reads the /proc/$pid/smaps file and represents the data in a more readable format. On Linux, there is the command line option -XX which displays all information the kernel provides (the output might change when newer kernels provide different metrics). Lets consider the following simple C program:
#include <stdio.h>

int main(int argc, char *argv[]) {
    getchar();
    return 0;
}
We can now launch this application (called “minimal”) and call pmap with its process id:
$ ./minimal & pmap -XX $!
As a result, we get the output as shown in this cheat sheet (click on the image for a larger, readable version):
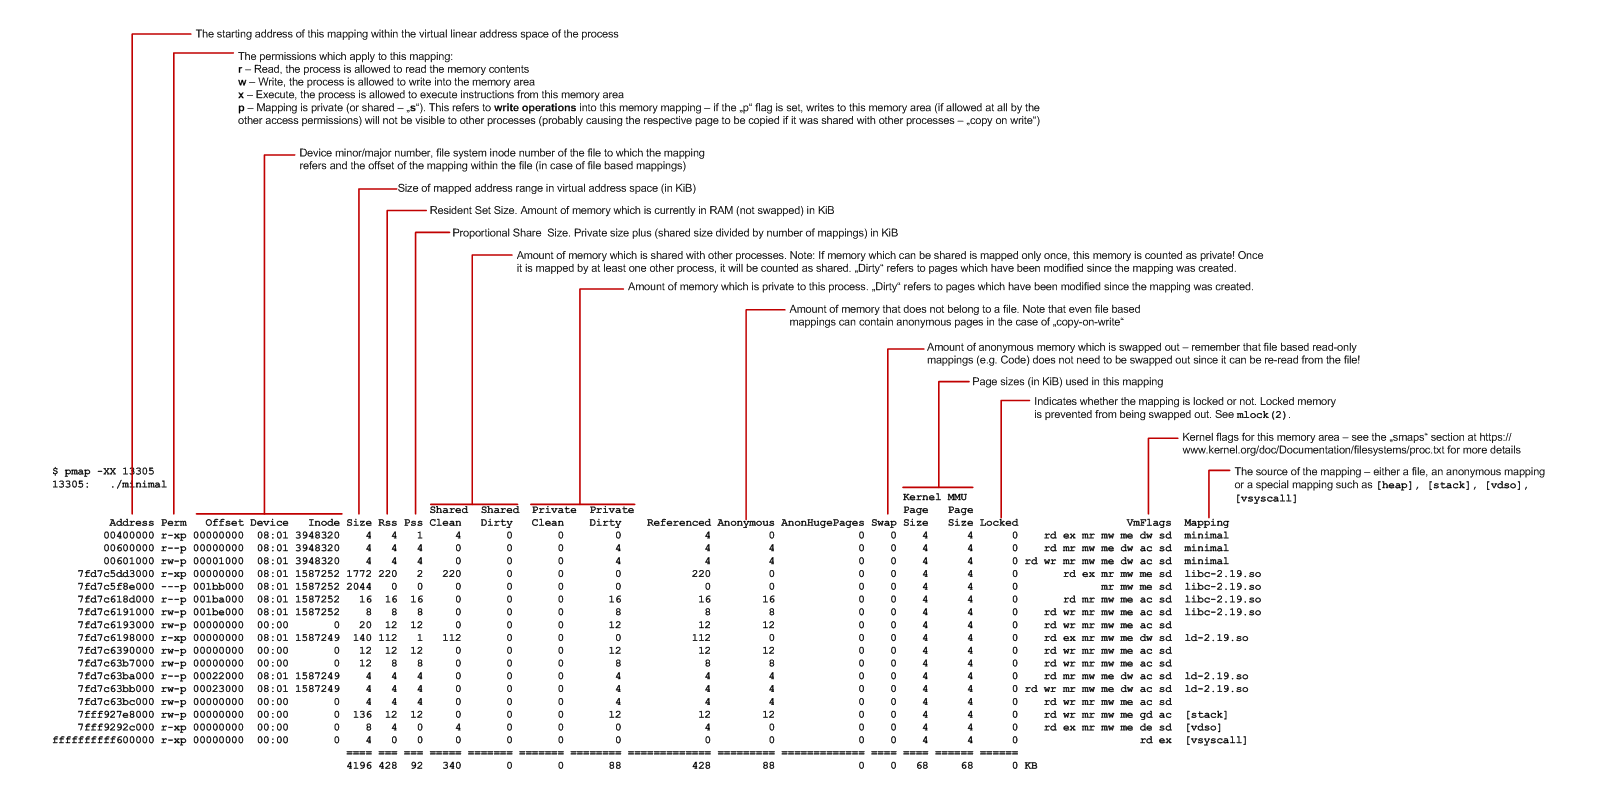
One interesting metric is the PSS value, also known as “Proportional Share Size”. This is the amount of memory which is private to the mapping, plus the partial amount of shared mappings of this process. For example, if the process has mapped 100 KiB of private memory, another 200 KiB of shared memory which is shared between two processes and another 150 KiB which is shared between three processes, the PSS is calculated like 100 KiB + 200 KiB / 2 + 150 KiB / 3 = 250 KiB. This can be directly observed when starting the “minimal” application more than once. Lets examine the first mapping which is reported my pmap when the application is started once (this is the code section of the executable) (only showing the first few columns here):
$ ./minimal & pmap -XX $!
         Address Perm   Offset Device   Inode Size Rss Pss Shared_Clean Shared_Dirty Private_Clean Private_Dirty
        00400000 r-xp 00000000  08:01 3948320    4   4   4            0            0             4             0
The application now continues to run, and we can simply start it once again and dump the mappings of this new process:
$ ./minimal & pmap -XX $!
         Address Perm   Offset Device   Inode Size Rss Pss Shared_Clean Shared_Dirty Private_Clean Private_Dirty
        00400000 r-xp 00000000  08:01 3948320    4   4   2            4            0             0             0
Here, we can observe two things:
- The Pss value for the new process is 2, not 4 – this is because the code section is shared between two processes, the one which we started first and the one which we started second
- The Private values are now 0, while the Shared values are now 4 – we are now sharing one page (4 KiB) between the two processes.
Furthermore, if we use pmap to examine the mapping of the first process again (assumed that its process ID was 13944), we see that also for this first process the values have changed:
$ pmap -XX 13944
13944:   ./minimal
         Address Perm   Offset Device   Inode Size Rss Pss Shared_Clean Shared_Dirty Private_Clean Private_Dirty
        00400000 r-xp 00000000  08:01 3948320    4   4   2            4            0             0             0
![]() Note that memory which can be shared (e.g. Code from a shared library) but which is mapped only into this particular process is counted as private, unless it will be mapped in at least one additional process.
Note that memory which can be shared (e.g. Code from a shared library) but which is mapped only into this particular process is counted as private, unless it will be mapped in at least one additional process.
Cheat sheet: understanding the pmap(1) output Read More »