Linux

Bad network performance after suspend/resume

I am observing several issues with suspend/resume on my Lenovo Thinkpad L15 G2 (Intel) running Ubuntu 21.04 (currently with kernel 5.11.0-25). One of these issues is that, after the machine wakes up from suspend, the wired network speed was very slow. I used the Vodafone speed check (speedtest.vodafone.de) which indeed showed only a download rate between 2 and 4 MBit/sec. (which really should be > 300 MBit/sec). In this article I describe some of the steps I took to further track this down.

First of all, I made sure that the issue is really reproducible in a simple scenario. And indeed, after reboot the network speed was fine until I did a suspend/resume cycle. After wakeup, the network speed was bad, and the only immediate solution was to reboot, which fixed the network speed until after the next wakeup.

In the next step, I tried bringing the network down and up again. For that, we first need to find out the interface name of the wired network device:

$ ip link show
1: lo: <LOOPBACK,UP,LOWER_UP> mtu 65536 qdisc noqueue state UNKNOWN mode DEFAULT group default qlen 1000
    link/loopback 00:00:00:00:00:00 brd 00:00:00:00:00:00
2: enp0s31f6: <BROADCAST,MULTICAST,UP,LOWER_UP> mtu 1500 qdisc fq_codel state UP mode DEFAULT group default qlen 1000
    link/ether 38:f3:ab:48:8e:2b brd ff:ff:ff:ff:ff:ff
3: wlp9s0: <BROADCAST,MULTICAST,UP,LOWER_UP> mtu 1500 qdisc noqueue state UP mode DORMANT group default qlen 1000
    link/ether c0:3c:59:29:40:5f brd ff:ff:ff:ff:ff:ff

Here enp0s31f6 is the wired LAN interface. Now we can bounce the network interface (note that this requires root access):

# ip link set dev enp0s31f6 down ; ip link set dev enp0s31f6 up

However, this did not fix the issue. The network speed was still slow.

The next try was to reload the module which contains the device driver for the network device. In order to do this, I first had to check which network controller is actually used in the laptop – a simply way is to search the list of PCI devices:

# lspci | grep -i eth
00:1f.6 Ethernet controller: Intel Corporation Ethernet Connection (13) I219-V (rev 20)

So, the network controller is an Intel I219-V. A quick google search (“Intel I219-V linux driver”) revealed that the kernel module is called e1000e. Alternatively, the hwinfo command can be used which directly shows the driver which is used for a particular device:

# hwinfo
...
88: None 00.0: 10701 Ethernet
  [Created at net.126]
  Unique ID: 23b5.ndpeucax6V1
  Parent ID: AhzA.zr6+Yth08U0
  SysFS ID: /class/net/enp0s31f6
  SysFS Device Link: /devices/pci0000:00/0000:00:1f.6
  Hardware Class: network interface
  Model: "Ethernet network interface"
  Driver: "e1000e"
  Driver Modules: "e1000e"
  Device File: enp0s31f6
  HW Address: 38:f3:ab:48:8e:2b
  Permanent HW Address: 38:f3:ab:48:8e:2b
  Link detected: yes
  Config Status: cfg=new, avail=yes, need=no, active=unknown
  Attached to: #34 (Ethernet controller)

Now I was able to reload the module:

# lsmod | grep e1000e
e1000e                270336  0
# rmmod e1000e
# lsmod | grep e1000e
# modprobe e1000e

It is always a good idea to double check if a particular command has the expected result – in this case that the module has really been unloaded.

Unfortunately, this also did not fix the speed issue.

Now, I decided to dig further into the network infrastructure. Since the Vodafone speed test is not always reliable (in fact they had another outage exactly at that day when I was investigating this speed issue), I first have set up a local environment where I could reproduce the issue without relying on any Internet connection. I have another computer available in my local network, so I used iperf to do some performance checks. I started an iperf server on the other node:

otherNode$ iperf -s
------------------------------------------------------------
Server listening on TCP port 5001
TCP window size:  128 KByte (default)
------------------------------------------------------------

and used the iperf client on the laptop to start the measurement:

thinkpad$ iperf -c otherNode
------------------------------------------------------------
Client connecting to otherNode, TCP port 5001
TCP window size:  620 KByte (default)
------------------------------------------------------------
[  3] local 192.168.1.56 port 35608 connected with 192.168.1.57 port 5001
[ ID] Interval       Transfer     Bandwidth
[  3]  0.0-10.0 sec  1.09 GBytes   936 Mbits/sec

This looks really good – and, after suspend/resume, I still got the same values!! This certainly means that the issue is in another layer of the network stack, right? Probably it is related to http only, or probably it is even a browser related issue …

But, no – the explanation was much simpler: by default, iperf -s (the server) is the data sink, and the client (iperf -c) is the side which generates and sends data. Hence, what I was testing with the above commands, was the upload speed and not the download speed (and, the upload speed was still fine even in the aforementioned speed test). So, in order to check the download speed I had to switch the roles of client and server. After starting iperf -s on the laptop and using iperf -c on the other node, I could immediately reproduce the issue. It now became clear that this is most likely related to the network interface / network controller which obviously fails to properly wakeup after the resume.

With that information, i now did another google search and finally found this issue: Massive network problems with I219-V on Thinkpad T14 Gen2 (e1000e). Besides some other issues (which I did NOT see on my machine) there were also mentioned some hibernation related issues. Luckily there was also a workaround posted which indicated that this might be related to the Intel Management Engine Interface, and they suggested to change a particular setting in the MEI:

$ lspci -vvnns 16                      # Check that config 16 is the number of MEI device
00:16.0 Communication controller [0780]: Intel Corporation Tiger Lake-LP Management Engine Interface [8086:a0e0] (rev 20)
	Subsystem: Lenovo Tiger Lake-LP Management Engine Interface [17aa:508f]
	Control: I/O- Mem+ BusMaster+ SpecCycle- MemWINV- VGASnoop- ParErr- Stepping- SERR- FastB2B- DisINTx+
	Status: Cap+ 66MHz- UDF- FastB2B- ParErr- DEVSEL=fast >TAbort- <TAbort- <MAbort- >SERR- <PERR- INTx-
	Latency: 0
	Interrupt: pin A routed to IRQ 147
	IOMMU group: 8
	Region 0: Memory at 601d189000 (64-bit, non-prefetchable) [size=4K]
	Capabilities: <access denied>
	Kernel driver in use: mei_me
	Kernel modules: mei_me

# echo on > /sys/bus/pci/devices/0000\:00\:16.0/power/control

And, indeed – this setting fixed the issue! So by setting the “power/control” property to “on” in the MEI, the issue was gone – the network speed is now still fine after suspend and wakeup.
Screen capturing in Wayland on Ubuntu 21.04

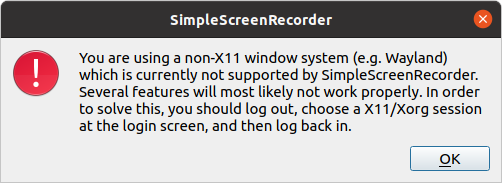
Ubuntu 21.04 has changed the graphics system from the Xorg server to the Wayland server. At first glance, this seems to work well – I had not even recognized this until I wanted to do a screen recording using SimpleScreenRecorder:

When I tried to create a screenshot of the above dialog using Shutter, the whole desktop was filled with this funny pattern:

So, it seems that especially screenshot and sreen recording applications still have their issues with the Wayland server. Before going back to Xorg as suggested by SimpleScreenSaver, I tried some alternative applications which reportedly already work with Wayland:

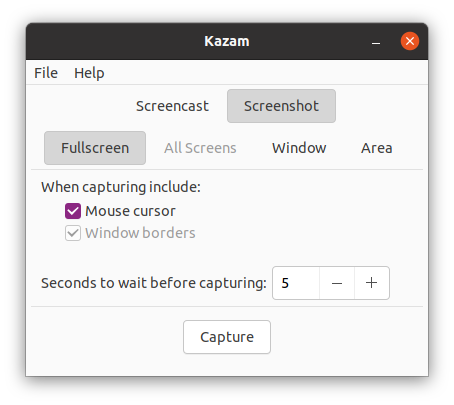
Kazam

Kazam is available in the universe repository. Hence installation with apt install kazam is straightforward. It looks less feature rich as SimpleScreenSaver though:

Unfortunately the application crashed several times while creating a screenshot from an area. Other options like “Fullscreen” did not work either, so I was not able to test it further.

Kooha

Kooha is relatively new, and there is no package available in the Ubuntu repository yet. So it needs to be built from source. meson and ninja are required for the build, and also a couple of build dependencies need to be satisfied, in particular gettext, libglib2.0-dev and appstream-util. Then, the application can be built using

$ git clone https://github.com/SeaDve/Kooha.git
$ cd Kooha
$ meson builddir --prefix=/usr/local
$ ninja -C builddir install

Unfortunately, running the application then terminates with an error which indicates that it requires Gtk 4.0 (Ubuntu is still on 3.38):

Traceback (most recent call last):
  File "/usr/local/bin/kooha", line 44, in <module>
    from kooha import main
  File "/usr/local/share/kooha/kooha/main.py", line 22, in <module>
    gi.require_version('Gtk', '4.0')
  File "/usr/lib/python3/dist-packages/gi/__init__.py", line 129, in require_version
    raise ValueError('Namespace %s not available for version %s' %
ValueError: Namespace Gtk not available for version 4.0

I decided not to track this down further.

OBS Studio

OBS Studio is a very feature rich application aimed especially towards screen recording and streaming. It is available in the universe repository, however this version (26.12) only records a black screen when using the Wayland server. Version 27.0 is available as Snap, and this seems to work well. After installing it with snap install obs-studio, I was able to create a screen recording and play it back with VLC.

However, the application crashes with a segmentation fault when starting it a second time. Removing the configuration files in the user’s snap directory solves this, but then requires to go through the complete setup process again when restarting the application.

Conclusion

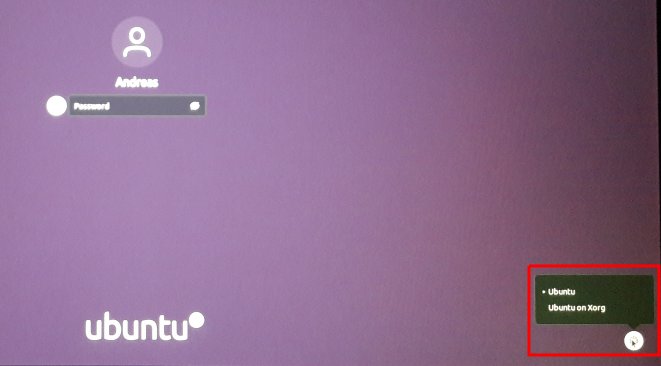
When doing a lot of screen capturing and/or screen recording, it is probably best to stay on Xorg for the time being – this can simply be configured with a button in the lower right corner on the login screen, after selecting the login user:

This selection is persisted across logout/login.
With the Xorg server, both Shutter and SimpleScreenRecorder are working again. Also, OBS Studio does not segfault when relaunching.

Cheat sheet: understanding the pmap(1) output

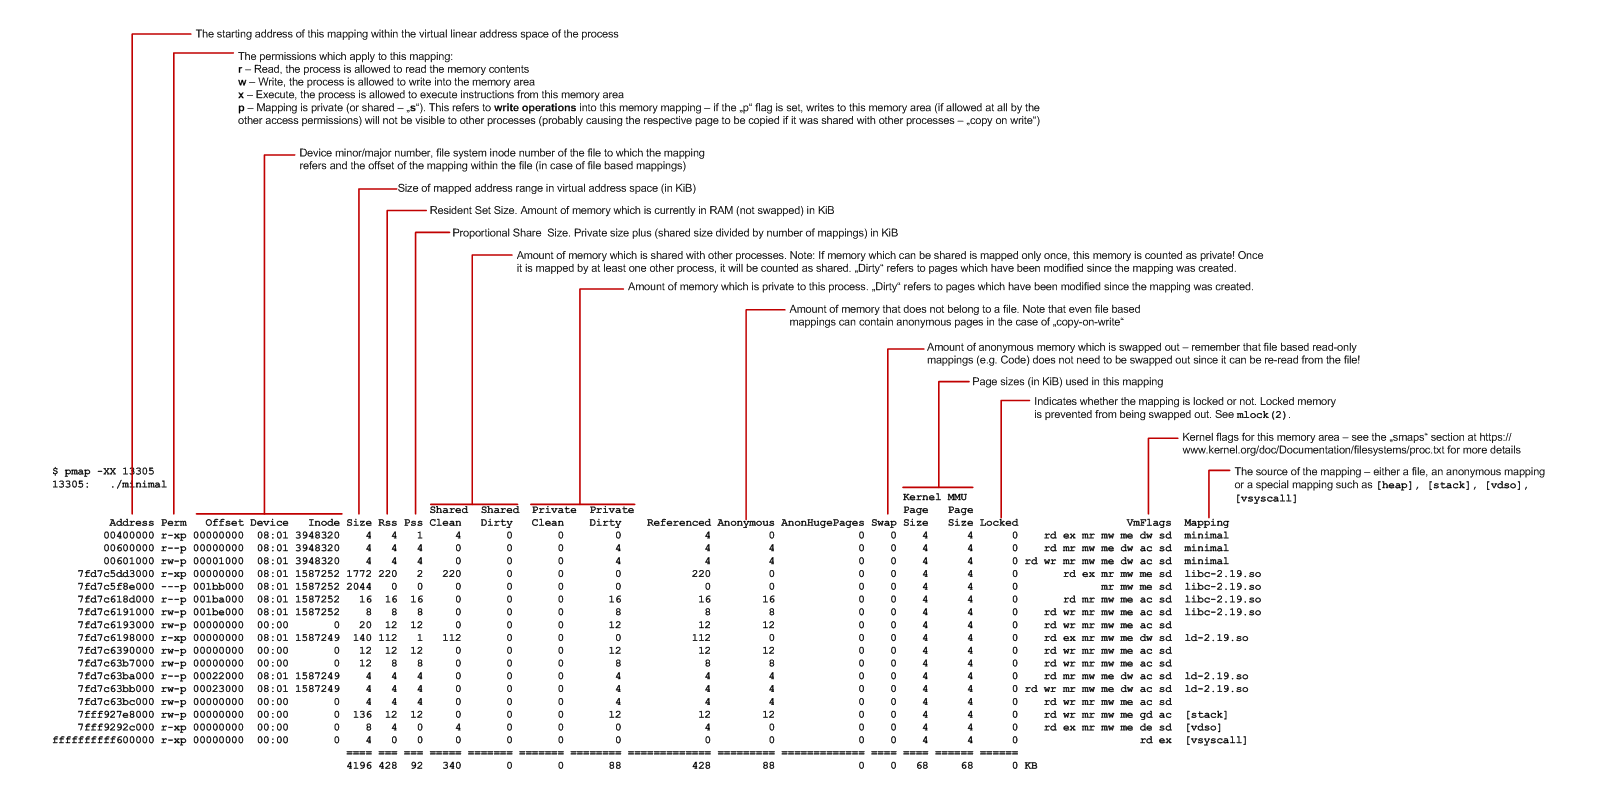
pmap(1) can be used to list the individual address areas which are mapped into a process. It essentially reads the /proc/$pid/smaps file and represents the data in a more readable format. On Linux, there is the command line option -XX which displays all information the kernel provides (the output might change when newer kernels provide different metrics). Lets consider the following simple C program:

#include <stdio.h>

int main(int argc, char *argv[]) {
    getchar();
    return 0;
}

We can now launch this application (called “minimal”) and call pmap with its process id:

$ ./minimal & pmap -XX $!

As a result, we get the output as shown in this cheat sheet (click on the image for a larger, readable version):

One interesting metric is the PSS value, also known as “Proportional Share Size”. This is the amount of memory which is private to the mapping, plus the partial amount of shared mappings of this process. For example, if the process has mapped 100 KiB of private memory, another 200 KiB of shared memory which is shared between two processes and another 150 KiB which is shared between three processes, the PSS is calculated like 100 KiB + 200 KiB / 2 + 150 KiB / 3 = 250 KiB. This can be directly observed when starting the “minimal” application more than once. Lets examine the first mapping which is reported my pmap when the application is started once (this is the code section of the executable) (only showing the first few columns here):

$ ./minimal & pmap -XX $!
         Address Perm   Offset Device   Inode Size Rss Pss Shared_Clean Shared_Dirty Private_Clean Private_Dirty 
        00400000 r-xp 00000000  08:01 3948320    4   4   4            0            0             4             0

The application now continues to run, and we can simply start it once again and dump the mappings of this new process:

$ ./minimal & pmap -XX $!
         Address Perm   Offset Device   Inode Size Rss Pss Shared_Clean Shared_Dirty Private_Clean Private_Dirty
        00400000 r-xp 00000000  08:01 3948320    4   4   2            4            0             0             0

Here, we can observe two things:

  • The Pss value for the new process is 2, not 4 – this is because the code section is shared between two processes, the one which we started first and the one which we started second
  • The Private values are now 0, while the Shared values are now 4 – we are now sharing one page (4 KiB) between the two processes.

Furthermore, if we use pmap to examine the mapping of the first process again (assumed that its process ID was 13944), we see that also for this first process the values have changed:

$ pmap -XX 13944
13944:   ./minimal
         Address Perm   Offset Device   Inode Size Rss Pss Shared_Clean Shared_Dirty Private_Clean Private_Dirty
        00400000 r-xp 00000000  08:01 3948320    4   4   2            4            0             0             0

Note that memory which can be shared (e.g. Code from a shared library) but which is mapped only into this particular process is counted as private, unless it will be mapped in at least one additional process.

Tracing shared library calls with ltrace and latrace

Tracing shared library calls with ltrace

Similar to strace, which can be used to trace system calls, ltrace can be used to trace shared library calls. This can be very useful to get insight into the program flow of applications while analyzing an issue. Consider the following simple sample: hello.c:

include <stdio.h>

void helloFunc(const char* s) {
   printf(s);
}

hello.h:

void helloFunc(const char* s);

helloMain.c:

#include "hello.h"

int main() {
   helloFunc("Hello World, how are you?");
   return 0;
}

We create a shared library from hello.c:

$ gcc -fPIC --shared -o libhello.so hello.c

And we create the executable from helloMain.c which links against the library created before:

$ gcc -o hello helloMain.c -lhello -L.

We can now use ltrace to see which library calls are executed:

$ export LD_LIBRARY_PATH=.
$ ltrace ./hello 
__libc_start_main(0x40069d, 1, 0x7fffe2f3b778, 0x4006c0 <unfinished ...>
helloFunc(0x400744, 0x7fffe2f3b778, 0x7fffe2f3b788, 0)              = 25
Hello World, how are you?+++ exited (status 0) +++

One drawback with ltrace is that it only traces calls from the executable to the libraries the executable is linked against – it does not trace calls between libraries! Hence, the call to the printf() function (which itself resides in the libc shared library) is not shown in the output. Also, there is no option to include the library name in the output for each of the called functions.

Tracing shared library calls with latrace

Especially for larger applications, a better alternative to ltrace is latrace which uses the LD_AUDIT feature from the libc library (available from libc 2.4 onward). On Ubuntu, it can be installed with

$ sudo apt-get install latrace

When using latrace with the sample program from above, there are two important differences:

  • First, latrace also traces library calls between shared libraries, so the output includes the printf call executed from our own shared library.
  • Second, the shared library name which contains the symbol is printed after each function call:

$ latrace ./hello
10180     _dl_find_dso_for_object [/lib64/ld-linux-x86-64.so.2]  
10180     __libc_start_main [/lib/x86_64-linux-gnu/libc.so.6]  
10180       helloFunc [./libhello.so]  
10180         printf [/lib/x86_64-linux-gnu/libc.so.6]  
10180       __tls_get_addr [/lib64/ld-linux-x86-64.so.2]  
10180       __cxa_finalize [/lib/x86_64-linux-gnu/libc.so.6]  
Hello World, how are you?
./hello finished - exited, status=0

By default, function parameters are not shown, but this can be enabled with the -A option:

$ latrace -A ./hello
10190     _dl_find_dso_for_object [/lib64/ld-linux-x86-64.so.2]  
10190     __libc_start_main(main = 0x40069d, argc = 1, ubp_av = 0x7fffccd35248, auxvec = 0x4006c0, init = 0x400730, fini = 0x7f3d16b21560, rtld_fini = 0x7fffccd35238) [/lib/x86_64-linux-gnu/libc.so.6] {
10190       helloFunc [./libhello.so]  
10190         printf(format = "Hello World, how are you?") [/lib/x86_64-linux-gnu/libc.so.6] {
Hello World, how are you?10190         } printf = 25
10190       __tls_get_addr [/lib64/ld-linux-x86-64.so.2]  
10190       __cxa_finalize(ptr = 0x7f3d1650b030) [/lib/x86_64-linux-gnu/libc.so.6] {
10190       } __cxa_finalize = void

With -A, ltrace uses some configuration files at /etc/latrace.d to define the parameter format for a set of well-known functions such as printf. We can see in the output that, even though helloFunc() takes a parameter, this parameter is not shown in the output (since it is not defined in the configuration files). We can use the -a option to specify our own argument definition file. An argument definition file is essentially a header file which defines the prototypes for all functions for which the arguments should be displayed in the output. On Ubuntu, the default argument definition files are stored at /etc/latrace.d/headers/, and there is a master file /etc/latrace.d/headers/latrace.h which includes the other header files. We can use the same approach in our own definition file, by first including the master file from /etc/latrace.d/headers/latrace.h and then add the prototypes for each function we want to trace. For our ssample above, the file could look like

#include "/etc/latrace.d/headers/latrace.h"
void helloFunc(const char* s);

Assumed this file is called mylatrace.h, wen can now use the -a option to pass the file to latrace:

$ latrace -a mylatrace.h -A ./hello
10801     _dl_find_dso_for_object [/lib64/ld-linux-x86-64.so.2]  
10801     __libc_start_main(main = 0x40069d, argc = 1, ubp_av = 0x7fff4b89fb58, auxvec = 0x4006c0, init = 0x400730, fini = 0x7f1927ea1560, rtld_fini = 0x7fff4b89fb48) [/lib/x86_64-linux-gnu/libc.so.6] {
10801       helloFunc(s = "Hello World, how are you?") [./libhello.so] {
10801         printf(format = "Hello World, how are you?") [/lib/x86_64-linux-gnu/libc.so.6] {
10801         } printf = 25
10801       } helloFunc = void
10801       __tls_get_addr [/lib64/ld-linux-x86-64.so.2]  
Hello World, how are you?10801       __cxa_finalize(ptr = 0x7f192788b030) [/lib/x86_64-linux-gnu/libc.so.6] {
10801       } __cxa_finalize = void
./hello finished - exited, status=0

As you can see in the output, we now also see that helloFunc() is called with one parameter s which is set to “Hello World, how are you?”.