Month: April 2015

Understanding free and top memory statistics [Update]

Both top and free can be used to gather basic information about memory usage, but each of them reports the statistics in a slightly different way which might not be directly obvious. An example output of free, using the -m switch to report numbers in MiB instead of KiB, is as follows:

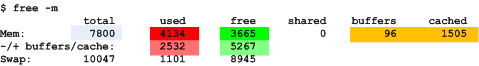
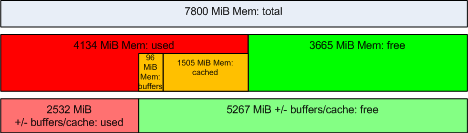
Lets ignore the last line (Swap – it simply shows the total swap space and how much from that swap space is allocated and how much is still free) and focus on physical memory: The first three numbers in the Mem: line are straight forward: the “total” column shows the total physical memory available (most likely, this system has 8 GiB installed and uses a part of it for its graphics device, hence the “total” column shows less than 8 GiB). The “used” column shows the amount of memory which is currently in use, and the “free” column shows the amount which is still available. Then, there are the “buffers” and “cached” columns – they show how much from the “used” memory is really used for buffers and caches. Buffers and caches is memory which the kernel uses for temporary data – if an application requires more memory, and there is no memory “free” anymore, the kernel can still use this temporary memory and assign it to application processes (probably resulting in lower I/O performance since there is not as much cache memory available now). Finally, there is the “+/- buffers/cache” line: This might look strange first, but what it does is that it also reports the “used” and “free” memory, without the buffers and caches – as said above, buffer and cache memory is dynamic and can be assigned to an application process, if required. Hence, the “+/- buffers/cache” line actually shows the memory which is used by and available for processes. The following diagram shows the memory allocation from the sample above:

top returns almost the same information, in a slightly different layout (note that the numbers are somewhat different since some time has elapsed between the execution of the two commands):

The main difference is that it does not directly show the “used” and “free” memory without the buffers – but this can be easily calculated. Another thing which looks strange is that the amount of “cached” memory is shown in the “Swap” line – however, it has nothing to do with swap, probably it has been put there to use the available screen area as efficient as possible.

Update: procps >= 3.3.10

Starting with procps 3.3.10, the output of free has changed which might cause some confusion. I came across this through a question on StackOverflow: Linux “free -m”: Total, used and free memory values don’t add up. Essentially, free does not show the “+/- buffers/cache” line anymore, but instead shows an “available” column which is taken from the MemAvailable metric which has been introduced with kernel 3.14. See https://www.kernel.org/doc/Documentation/filesystems/proc.txt for a complete description:

MemAvailable: An estimate of how much memory is available for starting new applications, without swapping. Calculated from MemFree, SReclaimable, the size of the file LRU lists, and the low watermarks in each zone. The estimate takes into account that the system needs some page cache to function well, and that not all reclaimable slab will be reclaimable, due to items being in use. The impact of those factors will vary from system to system.
The new format of the free output looks like this:

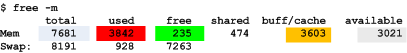
The main difference is that the “buff/cache” values are not part of “Used” anymore, but counted separately. Hence, the total memory is calculated as “used + buff/cache + free”:

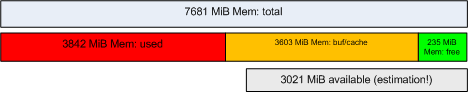
Since the “available” value is an estimation which considers some system specific factors, it can not directly be calculated from the other values which are shown by free.

Examining nested stack traces

I often read Java Stack traces bottom up when I examine them for the first time – simply because this is the code path which was executed when the exception occurred. However, it can happen that the last line of a stack trace shows something like ... 2 more – so, one might ask why can’t the runtime just dump those missing lines, along with all the other stack trace elements? Real life server stack traces sometimes contain dozens of lines, it should not matter to print those additional lines, right? And often those lines contain just the information you require to see from where the problematic code which caused the exception was called … The thing is: those lines are actually in the stack trace. Lets consider this example:

Exception in thread "main" java.lang.RuntimeException: java.lang.RuntimeException: Exception thrown
	at com.example.TraceTest.doSomething(TraceTest.java:13)
	at com.example.TraceTest.run(TraceTest.java:6)
	at com.example.TraceTest.main(TraceTest.java:22)
Caused by: java.lang.RuntimeException: Exception thrown
	at com.example.TraceTest.throwAnException(TraceTest.java:18)
	at com.example.TraceTest.doSomething(TraceTest.java:11)
	... 2 more

As you can see, the last line reads ... 2 more, but it might be crucial for the further analysis to know from where the doSomething() method was called. In order to get this information, we need to look further up in the stack trace: There, we again find the doSomething() method at the top and see that it was called from the run() method. In other words, the initial entry point for the code flow is the last element of the first stack trace block – from there, we can follow to the next stack trace block to see where the exception was finally thrown:

The reason for this is that the original exception was wrapped as nested exception into another exception. The following is the code which was used for the test above:

package com.example;

public class TraceTest {
    
    public void run() {
        doSomething();
    }

    private void doSomething() {
        try {
            throwAnException();
        }catch(RuntimeException re) {
            throw new RuntimeException(re);
        }
    }

    private void throwAnException() {
        throw new RuntimeException("Exception thrown");
    }

    public static void main(String[] args) {
        new TraceTest().run();
    }
}

Real stack traces might also contain more than one nested exception, so it might be necessary to follow them more than once.

In any case, the stack trace still contains the whole code path from the entry point (usually main) to the place where the exception was thrown.

See also how to print the full stacktrace in java on StackOverflow.

Defining a custom core file handler

I recently was wondering how apport can intercept core files written by the Linux kernel. Essentially, there is a kernel interface which allows to execute arbitrary commands whenever the kernel generates a core file. Earlier, this was used to fine tune the filename of the core file, like adding a time stamp or the user id of the process which generated the core file, instead of just plain core. The file name pattern can be defined through a special file located at /proc/sys/kernel/core_pattern. Since kernel 2.6.19, /proc/sys/kernel/core_pattern also supports a pipe mechanism. This allows to send the whole core file to stdin of an arbitrary program which can then further handle the core file generation. Additional parameters like the process id can be passed to the command line arguments of the program by using percent specifiers. On Ubuntu, by default /proc/sys/kernel/core_pattern contains the following string:

|/usr/share/apport/apport %p %s %c %P

This means to send the core file to stdin of /usr/share/apport/apport, and pass additional parameters like the process id to the command line parameters. See https://man7.org/linux/man-pages/man5/core.5.html for more information about the supported % specifiers.

Example: automatically launching a debugger

It is also possible to execute a shell script, which makes it very easy to execute specific actions whenever a core file is generated. Lets assume we want to launch the gdb debugger each time a core file is created, load the crashed program together with the core file and automatically show the call stack where the program crashed. This can be achieved by the following script:

#!/bin/bash

# Get parameters passed from the kernel
EXE=`echo $1 | sed -e "s,!,/,g"`
EXEWD=`dirname ${EXE}`
TSTAMP=$8

# Read core file from stdin
COREFILE=/tmp/core_${TSTAMP}
cat > ${COREFILE}

# Launch xterm with debugger session
xterm -display :1 -e "gdb ${EXE} -c ${COREFILE} -ex \"where\"" &

Now, all we need to do is to register the script in /proc/sys/kernel/core_pattern (we need to do this as root, of course). Assumed that the script is stored as /tmp/handler.sh, we can use the following command to have the kernel execute it whenever a core file is to be written:

# echo '|/tmp/handler.sh %E %p %s %c %P %u %g %t %h %e' > /proc/sys/kernel/core_pattern

Fsor the script above, we would only need the %E and %t specifiers, but by passing all available parameters we can adjust the script without the need to modify /proc/sys/kernel/core_pattern when additional parameters are required. From now on, whenever a core dump is generated, an xterm window will open, gdb will be launched, the crashed file together with the core dump will be loaded into the debugger and the where command will be executed to show the call stack up to the location where the program crashed. The following screenshot shows the execution of the stack smashing sample I wrote about earlier.

Note: the xterm and all programs within it will be run as root user, so be careful with what you do inside the xterm!