In an earlier posting, I showed how to log particular expressions like the current value of a method parameter to the console during a debug session, using JDeveloper, without the need to continously press the “resume” button. The same is also possible in Eclipse. Lets assume we have the following code which does some calculations:

package com.example;

public class DebugSample {
    
    private double calculate(double input) {
        return Math.sin(input * input); 
    }

    private void processValue(double value) {
        // ...
    }

    private void run() {
        double value = 0.0;
        while(value < 20) {
            double newValue = calculate(value);
            processValue(newValue); // do some processing with the calculated value
            value = value + 0.5;
        }
    }

    public static void main(String[] args) {
        new DebugSample().run();
    }
}

Now, if we want to check the contents of the calculated value (newValue) inside the while loop, we can simply set a breakpoint at the line after the call to the calculate() method: IMG Then, we can launch the application under debugger control and inspect the current contents of the newValue variable in the “Variables” tab: IMG By pressing Resume (or F8), we can watch how the value changes in each iteration of the for-loop. However, this can be tedious, especially if we expect that some issue only occurs after several dozens of iterations. We could add a System.err.println() statement to dump the values to the console, but in more complex environments this is often not possible (or at least not simple), e.g. when doing remote debugging of a web application. Fortunately, we can define a conditional breakpoint and use a side effect of the breakpoint condition to log variable contents to the console when the breakpoint is hit, while letting the application resume automatically. Simply select the breakpoint in the “Breakpoints” tab and check the “Conditional” flag: IMG By setting “Suspend when true” (which is the default), we can control through the return value of the condition whether the application should be suspended or resumed automatically. In the text field below, we define the condition (which is really Java code fragment) which gets executed every time the breakpoint is hit. In our case, the code finally returns “false”, which means that the application is never suspended when the breakpoint is hit, but resumes immediately. Since the condition is not only a closed expression, but a real Java code fragment including more than one statements, we could also add an if condition to restrict the output to specific value ranges: IMG In this example, the output only occurs when value is larger than 10.
Cheat sheet: understanding the pmap(1) output

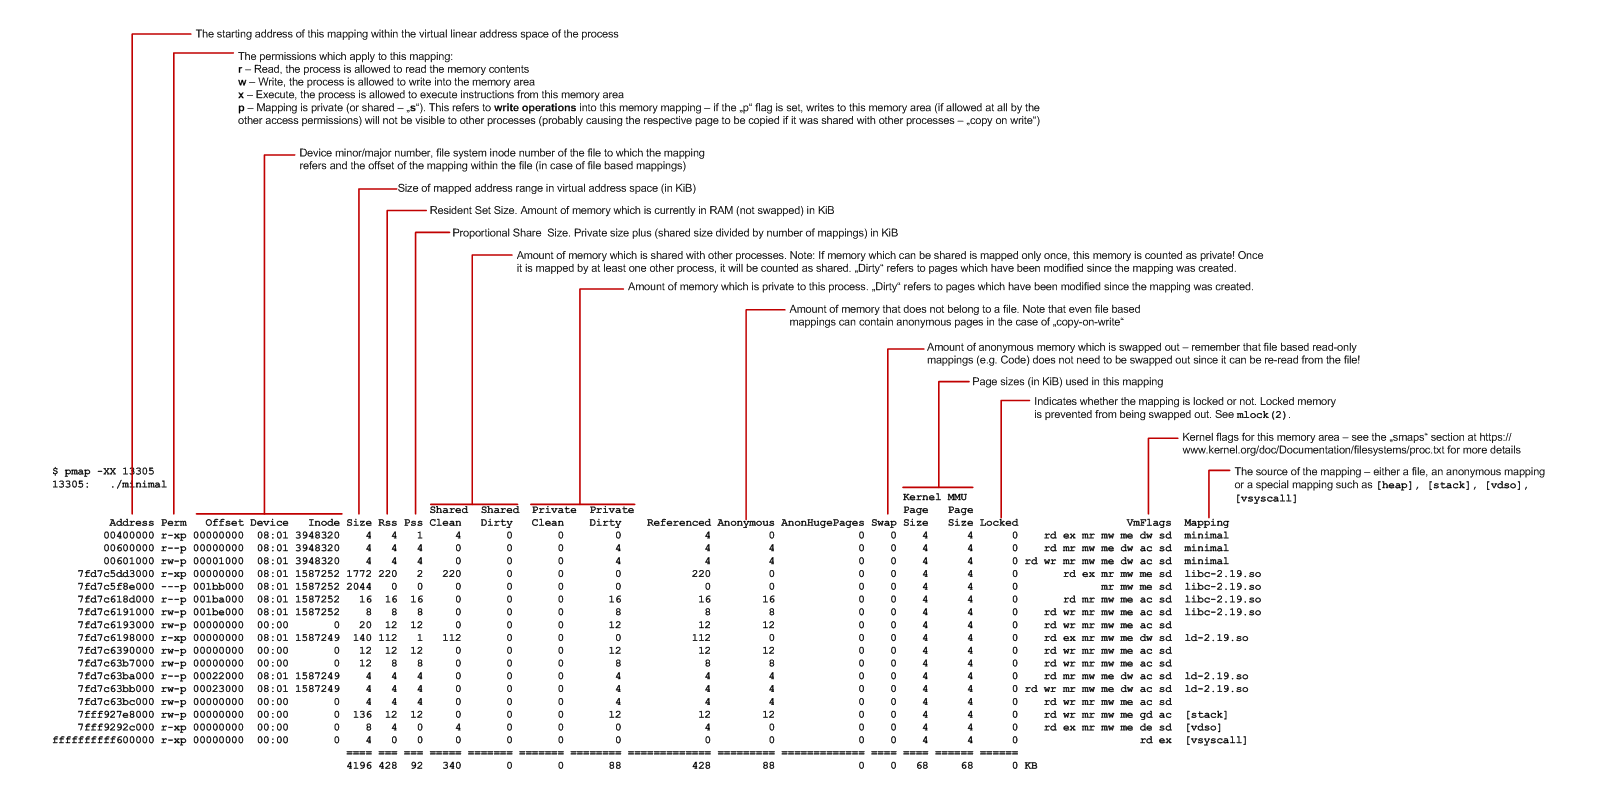
pmap(1) can be used to list the individual address areas which are mapped into a process. It essentially reads the /proc/$pid/smaps file and represents the data in a more readable format. On Linux, there is the command line option -XX which displays all information the kernel provides (the output might change when newer kernels provide different metrics). Lets consider the following simple C program:

#include <stdio.h>

int main(int argc, char *argv[]) {
    getchar();
    return 0;
}

We can now launch this application (called “minimal”) and call pmap with its process id:

$ ./minimal & pmap -XX $!

As a result, we get the output as shown in this cheat sheet (click on the image for a larger, readable version):

One interesting metric is the PSS value, also known as “Proportional Share Size”. This is the amount of memory which is private to the mapping, plus the partial amount of shared mappings of this process. For example, if the process has mapped 100 KiB of private memory, another 200 KiB of shared memory which is shared between two processes and another 150 KiB which is shared between three processes, the PSS is calculated like 100 KiB + 200 KiB / 2 + 150 KiB / 3 = 250 KiB. This can be directly observed when starting the “minimal” application more than once. Lets examine the first mapping which is reported my pmap when the application is started once (this is the code section of the executable) (only showing the first few columns here):

$ ./minimal & pmap -XX $!
         Address Perm   Offset Device   Inode Size Rss Pss Shared_Clean Shared_Dirty Private_Clean Private_Dirty 
        00400000 r-xp 00000000  08:01 3948320    4   4   4            0            0             4             0

The application now continues to run, and we can simply start it once again and dump the mappings of this new process:

$ ./minimal & pmap -XX $!
         Address Perm   Offset Device   Inode Size Rss Pss Shared_Clean Shared_Dirty Private_Clean Private_Dirty
        00400000 r-xp 00000000  08:01 3948320    4   4   2            4            0             0             0

Here, we can observe two things:

  • The Pss value for the new process is 2, not 4 – this is because the code section is shared between two processes, the one which we started first and the one which we started second
  • The Private values are now 0, while the Shared values are now 4 – we are now sharing one page (4 KiB) between the two processes.

Furthermore, if we use pmap to examine the mapping of the first process again (assumed that its process ID was 13944), we see that also for this first process the values have changed:

$ pmap -XX 13944
13944:   ./minimal
         Address Perm   Offset Device   Inode Size Rss Pss Shared_Clean Shared_Dirty Private_Clean Private_Dirty
        00400000 r-xp 00000000  08:01 3948320    4   4   2            4            0             0             0

Note that memory which can be shared (e.g. Code from a shared library) but which is mapped only into this particular process is counted as private, unless it will be mapped in at least one additional process.

Windows Clipboard Inspector

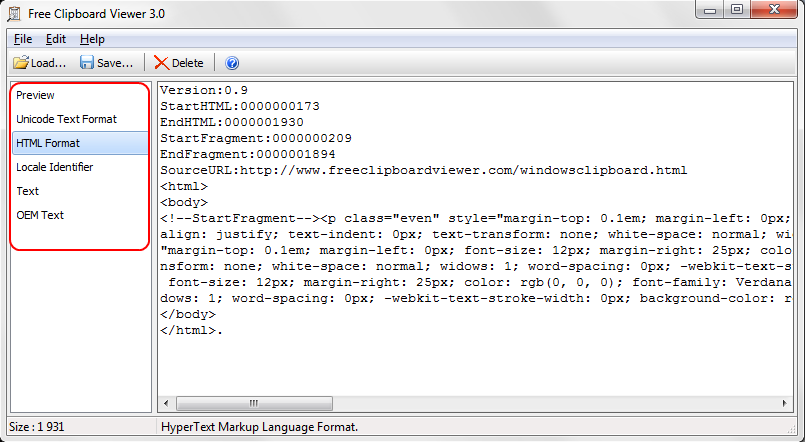
When working on copy&paste features, it is useful to be able to inspect the current contents of the Clipboard. Unfortunately, at least Windows 7 does not include a clipboard viewer which shows the current clipboard data in all available formats, but Free Clipboard Viewer seems to do the trick. It automatically updates whenever new content is copied into the clipboard and updates the list of available formats accordingly on the left side, while the content itself is displayed on the right side. The following screen shot shows how the tool displays a part of its own web page after some content has been marked and copied into the clipboard with CTRL-C: