Examining nested stack traces

I often read Java Stack traces bottom up when I examine them for the first time – simply because this is the code path which was executed when the exception occurred. However, it can happen that the last line of a stack trace shows something like ... 2 more – so, one might ask why can’t the runtime just dump those missing lines, along with all the other stack trace elements? Real life server stack traces sometimes contain dozens of lines, it should not matter to print those additional lines, right? And often those lines contain just the information you require to see from where the problematic code which caused the exception was called … The thing is: those lines are actually in the stack trace. Lets consider this example:

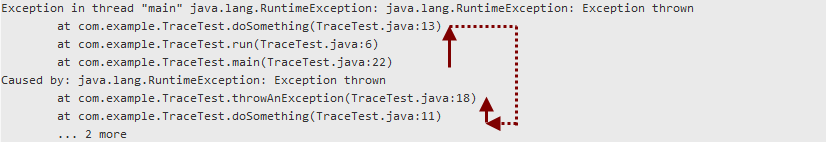
Exception in thread "main" java.lang.RuntimeException: java.lang.RuntimeException: Exception thrown
	at com.example.TraceTest.doSomething(TraceTest.java:13)
	at com.example.TraceTest.run(TraceTest.java:6)
	at com.example.TraceTest.main(TraceTest.java:22)
Caused by: java.lang.RuntimeException: Exception thrown
	at com.example.TraceTest.throwAnException(TraceTest.java:18)
	at com.example.TraceTest.doSomething(TraceTest.java:11)
	... 2 more

As you can see, the last line reads ... 2 more, but it might be crucial for the further analysis to know from where the doSomething() method was called. In order to get this information, we need to look further up in the stack trace: There, we again find the doSomething() method at the top and see that it was called from the run() method. In other words, the initial entry point for the code flow is the last element of the first stack trace block – from there, we can follow to the next stack trace block to see where the exception was finally thrown:

The reason for this is that the original exception was wrapped as nested exception into another exception. The following is the code which was used for the test above:

package com.example;

public class TraceTest {
    
    public void run() {
        doSomething();
    }

    private void doSomething() {
        try {
            throwAnException();
        }catch(RuntimeException re) {
            throw new RuntimeException(re);
        }
    }

    private void throwAnException() {
        throw new RuntimeException("Exception thrown");
    }

    public static void main(String[] args) {
        new TraceTest().run();
    }
}

Real stack traces might also contain more than one nested exception, so it might be necessary to follow them more than once.

In any case, the stack trace still contains the whole code path from the entry point (usually main) to the place where the exception was thrown.

See also how to print the full stacktrace in java on StackOverflow.

Defining a custom core file handler

I recently was wondering how apport can intercept core files written by the Linux kernel. Essentially, there is a kernel interface which allows to execute arbitrary commands whenever the kernel generates a core file. Earlier, this was used to fine tune the filename of the core file, like adding a time stamp or the user id of the process which generated the core file, instead of just plain core. The file name pattern can be defined through a special file located at /proc/sys/kernel/core_pattern. Since kernel 2.6.19, /proc/sys/kernel/core_pattern also supports a pipe mechanism. This allows to send the whole core file to stdin of an arbitrary program which can then further handle the core file generation. Additional parameters like the process id can be passed to the command line arguments of the program by using percent specifiers. On Ubuntu, by default /proc/sys/kernel/core_pattern contains the following string:

|/usr/share/apport/apport %p %s %c %P

This means to send the core file to stdin of /usr/share/apport/apport, and pass additional parameters like the process id to the command line parameters. See https://man7.org/linux/man-pages/man5/core.5.html for more information about the supported % specifiers.

Example: automatically launching a debugger

It is also possible to execute a shell script, which makes it very easy to execute specific actions whenever a core file is generated. Lets assume we want to launch the gdb debugger each time a core file is created, load the crashed program together with the core file and automatically show the call stack where the program crashed. This can be achieved by the following script:

#!/bin/bash

# Get parameters passed from the kernel
EXE=`echo $1 | sed -e "s,!,/,g"`
EXEWD=`dirname ${EXE}`
TSTAMP=$8

# Read core file from stdin
COREFILE=/tmp/core_${TSTAMP}
cat > ${COREFILE}

# Launch xterm with debugger session
xterm -display :1 -e "gdb ${EXE} -c ${COREFILE} -ex \"where\"" &

Now, all we need to do is to register the script in /proc/sys/kernel/core_pattern (we need to do this as root, of course). Assumed that the script is stored as /tmp/handler.sh, we can use the following command to have the kernel execute it whenever a core file is to be written:

# echo '|/tmp/handler.sh %E %p %s %c %P %u %g %t %h %e' > /proc/sys/kernel/core_pattern

Fsor the script above, we would only need the %E and %t specifiers, but by passing all available parameters we can adjust the script without the need to modify /proc/sys/kernel/core_pattern when additional parameters are required. From now on, whenever a core dump is generated, an xterm window will open, gdb will be launched, the crashed file together with the core dump will be loaded into the debugger and the where command will be executed to show the call stack up to the location where the program crashed. The following screenshot shows the execution of the stack smashing sample I wrote about earlier.

Note: the xterm and all programs within it will be run as root user, so be careful with what you do inside the xterm!

The GS segment and stack smashing protection

When disassembling (32 bit i386 / x86) code on Linux, we sometimes come across instructions like

...
call   *%gs:0x10
...
movl    %gs:0x14, %eax
...

Here, gs refers to the Thread Control Block (TCB) header which stores per-CPU and thread local data (Thread Local Storage, TLS). The Thread Control Block header is a structure which is defined in the C library, for example in eglibc-2.19/nptl/sysdeps/i386/tls.h (slightly simplified and added the gs segment offsets):

typedef struct {
  void *tcb;              /* gs:0x00 Pointer to the TCB. */
  dtv_t *dtv;             /* gs:0x04 */
  void *self;             /* gs:0x08 Pointer to the thread descriptor.  */
  int multiple_threads;   /* gs:0x0c */
  uintptr_t sysinfo;      /* gs:0x10 Syscall interface */
  uintptr_t stack_guard;  /* gs:0x14 Random value used for stack protection */
  uintptr_t pointer_guard;/* gs:0x18 Random value used for pointer protection */
  int gscope_flag;        /* gs:0x1c */
  int private_futex;      /* gs:0x20 */
  void *__private_tm[4];  /* gs:0x24 Reservation of some values for the TM ABI.  */
  void *__private_ss;     /* gs:0x34 GCC split stack support.  */
} tcbhead_t;

Lets take a closer look at gs:0x10 which I mentioned above: The stack_guard member contains a random value which is used to protect against stack smashing – consider the following sample which contains an obvious buffer overflow:

#include <string.h>

int main() {
   char buffer[4];
   strcpy(buffer, "Hello World");
   return 0;
}

When we compile and run this application, we will get a runtime error:

$ gcc -m32 -o smash smash.c
$ ./smash 
*** stack smashing detected ***: ./smash terminated
Aborted (core dumped)

Lets look at the code which is generated by the compiler:

$ gcc -m32 -S -o smash.S smash.c

The following is the (simplified and commented) smash.S file:

main:
; Set up the stack
        pushl   %ebp
        movl    %esp, %ebp
        andl    $-16, %esp
        subl    $16, %esp

; Set up stack guard
        movl    %gs:20, %eax       ; load random value
        movl    %eax, 12(%esp)     ; store value as a guard variable 
        xorl    %eax, %eax         ; make sure that noone can read the random value afterwards
;...
; strcpy ommitted (this overwrites 12(%esp) since the string is too large for the buffer)
;...

; Check stack guard against value from TCB
        movl    12(%esp), %edx     ; load previously stored value from stack
        xorl    %gs:20, %edx       ; check if still the same
        je      .L3                ; yes, then fine
        call    __stack_chk_fail   ; print error message and abort()
.L3:
        leave
        ret

As we see, the compiler inserts instructions at the beginning of the function to set up the stack guard variable, and it inserts instructions at the end of the function to check if the value has changed meanwhile (means, if any code within the function has written beyond the area allocated for local variables and hence has potentially overwritten the return address for the current function). The generation of the stack protection code can be disabled by passing the -fno-stack-protector option to gcc – this is something which should, of course, normally not be done but it can sometimes be useful in order to analyze certain security issues.

Eclipse Luna crashes with KDE on Ubuntu 14.04 LTS (Trusty)

This is an issue I came across today, after I upgraded my system to Ubuntu 14.04 LTS (Trusty) some days ago and after I also upgraded to Eclipse Luna 4.4.1 (using JDK 8u31): When importing an existing project into the workspace, the “Import Projects” dialog (where you can select the root directory) still opens, but then the JVM crashes with this assertion:

java: /build/buildd/gtk2-engines-oxygen-1.4.5/src/animations/oxygencomboboxdata.cpp:87: 
void Oxygen::ComboBoxData::setButton(GtkWidget*): Assertion `!_button._widget' failed.

After some searching, I found that this is a known KDE bug (there is also a corresponding Eclipse bug) and it has already been fixed in oxygen-gtk2-1.4.6. This version is already available in Ubuntu 15.04 (Vivid), but not yet in 14.04, so I crated a backport package – you can get it from my Personal Package Archive. After installing the upgraded package, the issue is gone (what remains is a message like Oxygen::WindowManager::wmButtonPress - warning: a button was already set for this combobox which is obvious when we look at the diff (have a look at the oxygencomboboxdata.cpp file). A different workaround in case you do not want or can install the new oxygen-gtk version is to set a different GTK style in the KDE control center:

Open the KDE System settings and select “Application Appearance”. In the dialog choose the GTK category and choose a different GTK style in the “Select a GTK2 Theme” dropdown, e.g. “Ambiance” as in the example below: