I recently was wondering how apport can intercept core files written by the Linux kernel. Essentially, there is a kernel interface which allows to execute arbitrary commands whenever the kernel generates a core file. Earlier, this was used to fine tune the filename of the core file, like adding a time stamp or the user id of the process which generated the core file, instead of just plain core. The file name pattern can be defined through a special file located at /proc/sys/kernel/core_pattern. Since kernel 2.6.19, /proc/sys/kernel/core_pattern also supports a pipe mechanism. This allows to send the whole core file to stdin of an arbitrary program which can then further handle the core file generation. Additional parameters like the process id can be passed to the command line arguments of the program by using percent specifiers. On Ubuntu, by default /proc/sys/kernel/core_pattern contains the following string:
|/usr/share/apport/apport %p %s %c %P
This means to send the core file to stdin of /usr/share/apport/apport, and pass additional parameters like the process id to the command line parameters. See https://man7.org/linux/man-pages/man5/core.5.html for more information about the supported % specifiers.
Example: automatically launching a debugger
It is also possible to execute a shell script, which makes it very easy to execute specific actions whenever a core file is generated. Lets assume we want to launch the gdb debugger each time a core file is created, load the crashed program together with the core file and automatically show the call stack where the program crashed. This can be achieved by the following script:
#!/bin/bash

# Get parameters passed from the kernel
EXE=`echo $1 | sed -e "s,!,/,g"`
EXEWD=`dirname ${EXE}`
TSTAMP=$8

# Read core file from stdin
COREFILE=/tmp/core_${TSTAMP}
cat > ${COREFILE}

# Launch xterm with debugger session
xterm -display :1 -e "gdb ${EXE} -c ${COREFILE} -ex \"where\"" &
Now, all we need to do is to register the script in /proc/sys/kernel/core_pattern (we need to do this as root, of course). Assumed that the script is stored as /tmp/handler.sh, we can use the following command to have the kernel execute it whenever a core file is to be written:
# echo '|/tmp/handler.sh %E %p %s %c %P %u %g %t %h %e' > /proc/sys/kernel/core_pattern
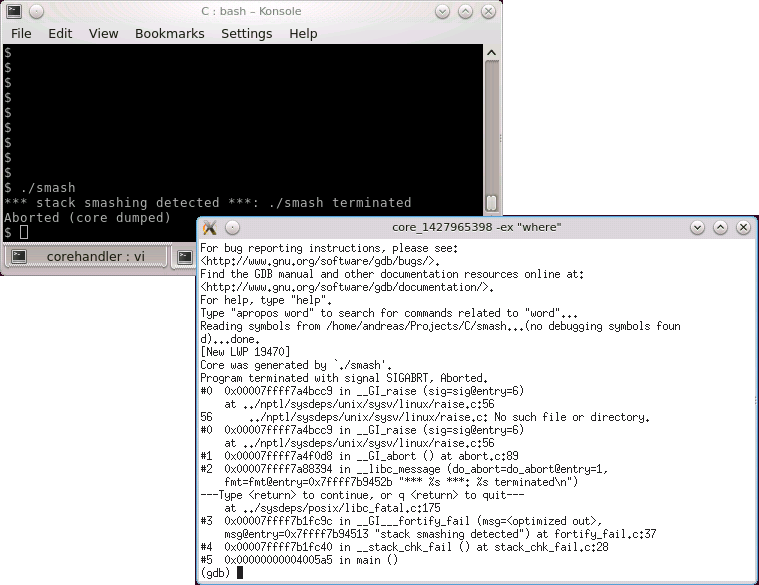
Fsor the script above, we would only need the %E and %t specifiers, but by passing all available parameters we can adjust the script without the need to modify /proc/sys/kernel/core_pattern when additional parameters are required. From now on, whenever a core dump is generated, an xterm window will open, gdb will be launched, the crashed file together with the core dump will be loaded into the debugger and the where command will be executed to show the call stack up to the location where the program crashed. The following screenshot shows the execution of the stack smashing sample I wrote about earlier.
![]() Note: the xterm and all programs within it will be run as root user, so be careful with what you do inside the xterm!
Note: the xterm and all programs within it will be run as root user, so be careful with what you do inside the xterm!