In Eclipse, it is possible to log particular expressions like the current value of a method parameter to the console during a debug session, without the need to continously press the “resume” button . Lets assume we have the following code which does some calculations:
package com.example;

public class DebugSample {

    private double calculate(double input) {
        return Math.sin(input * input);
    }

    private void processValue(double value) {
        // ...
    }

    private void run() {
        double value = 0.0;
        while(value < 20) {
            double newValue = calculate(value);
            processValue(newValue); // do some processing with the calculated value
            value = value + 0.5;
        }
    }

    public static void main(String[] args) {
        new DebugSample().run();
    }
}
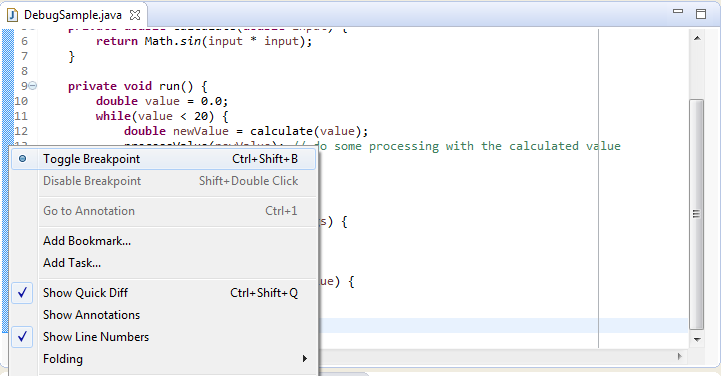
Now, if we want to check the contents of the calculated value (newValue) inside the while loop, we can simply set a breakpoint at the line after the call to the calculate() method:
Then, we can launch the application under debugger control and inspect the current contents of the newValue variable in the “Variables” tab:
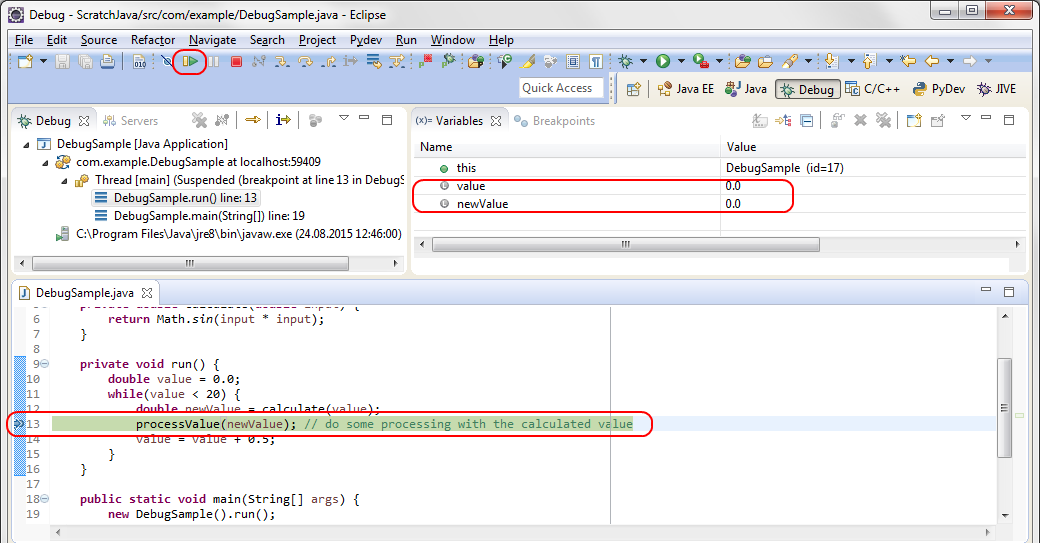
By pressing “Resume” (or F8), we can watch how the value changes in each iteration of the for-loop.
However, this can be tedious, especially if we expect that some issue only occurs after several dozens of iterations. We could add a System.err.println() statement to dump the values to the console, but this requires recompilation and redeployment. In more complex environments this is often not possible (or at least not simple), e.g. when doing remote debugging of a web application. Fortunately, we can define a conditional breakpoint and use a side effect of the breakpoint condition to log variable contents to the console when the breakpoint is hit, while letting the application resume automatically. Simply select the breakpoint in the “Breakpoints” tab and check the “Conditional” flag:
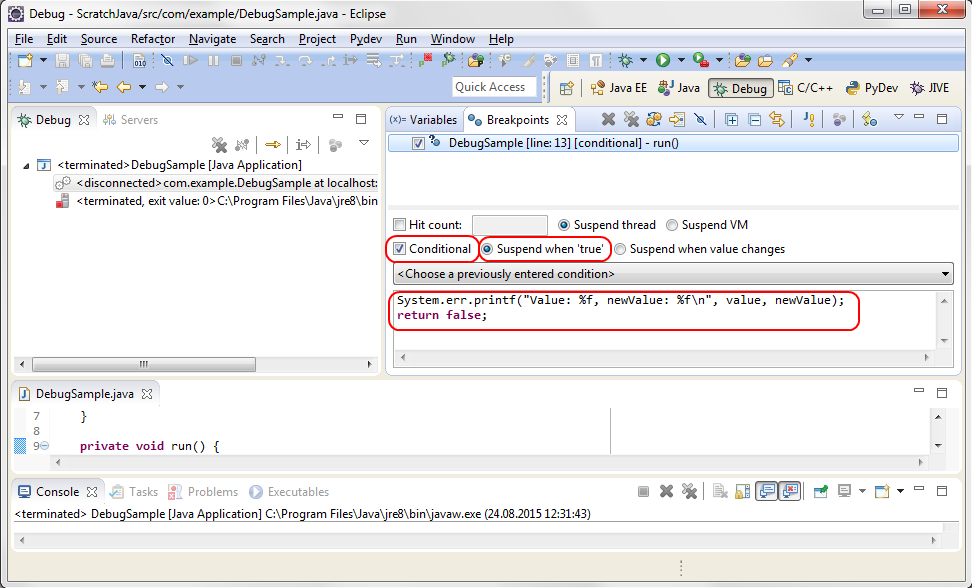
By setting “Suspend when true” (which is the default), we can control through the return value of the condition whether the application should be suspended or resumed automatically. In the text field below, we define the condition (which is really Java code fragment!) which gets executed every time the breakpoint is hit. In our case, the code finally returns “false”, which means that the application is never suspended when the breakpoint is hit, but resumes immediately.
Since the condition is not only a closed expression, but a real Java code fragment including more than one statements, we could also add an if condition to restrict the output to specific value ranges:
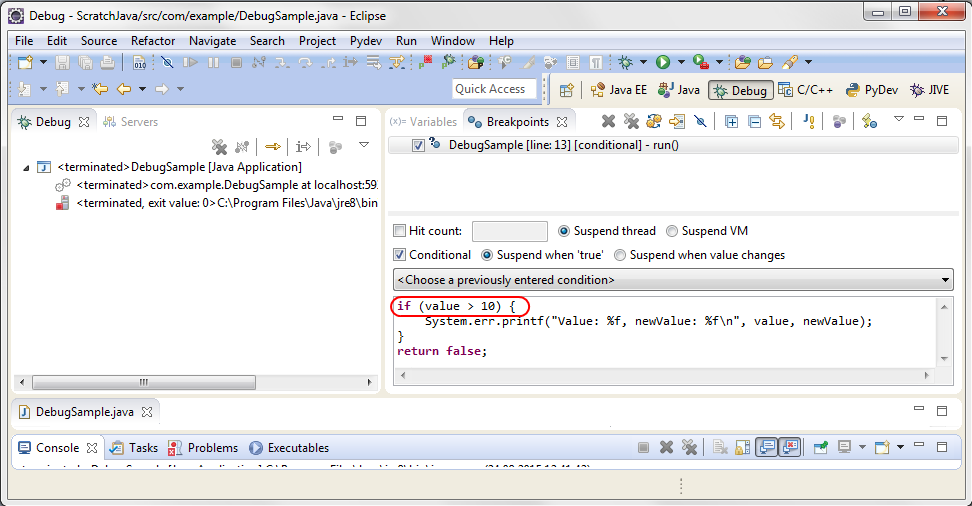
In this example, the output only occurs when value is larger than 10.
![]() There is one drawback of this approach when doing remote debugging: The code fragment for the condition runs in the remote VM. Hence, the output from System.err is not shown on the (local) Eclipse console, but whereever the error stream of the remote VM is redirected to. Usually it goes into a log file, so a tail -f on the log file should show the output. Alternatively, if the application is using a logging library, it should be possible to define a logger specifically for debug output and use this logger instead of System.err. Through a corresponding appender, the debug output can then be redirected to wherever it should go.
There is one drawback of this approach when doing remote debugging: The code fragment for the condition runs in the remote VM. Hence, the output from System.err is not shown on the (local) Eclipse console, but whereever the error stream of the remote VM is redirected to. Usually it goes into a log file, so a tail -f on the log file should show the output. Alternatively, if the application is using a logging library, it should be possible to define a logger specifically for debug output and use this logger instead of System.err. Through a corresponding appender, the debug output can then be redirected to wherever it should go.