Linux

Understanding free and top memory statistics [Update]

Both top and free can be used to gather basic information about memory usage, but each of them reports the statistics in a slightly different way which might not be directly obvious. An example output of free, using the -m switch to report numbers in MiB instead of KiB, is as follows:

Lets ignore the last line (Swap – it simply shows the total swap space and how much from that swap space is allocated and how much is still free) and focus on physical memory: The first three numbers in the Mem: line are straight forward: the “total” column shows the total physical memory available (most likely, this system has 8 GiB installed and uses a part of it for its graphics device, hence the “total” column shows less than 8 GiB). The “used” column shows the amount of memory which is currently in use, and the “free” column shows the amount which is still available. Then, there are the “buffers” and “cached” columns – they show how much from the “used” memory is really used for buffers and caches. Buffers and caches is memory which the kernel uses for temporary data – if an application requires more memory, and there is no memory “free” anymore, the kernel can still use this temporary memory and assign it to application processes (probably resulting in lower I/O performance since there is not as much cache memory available now). Finally, there is the “+/- buffers/cache” line: This might look strange first, but what it does is that it also reports the “used” and “free” memory, without the buffers and caches – as said above, buffer and cache memory is dynamic and can be assigned to an application process, if required. Hence, the “+/- buffers/cache” line actually shows the memory which is used by and available for processes. The following diagram shows the memory allocation from the sample above:

top returns almost the same information, in a slightly different layout (note that the numbers are somewhat different since some time has elapsed between the execution of the two commands):

The main difference is that it does not directly show the “used” and “free” memory without the buffers – but this can be easily calculated. Another thing which looks strange is that the amount of “cached” memory is shown in the “Swap” line – however, it has nothing to do with swap, probably it has been put there to use the available screen area as efficient as possible.

Update: procps >= 3.3.10

Starting with procps 3.3.10, the output of free has changed which might cause some confusion. I came across this through a question on StackOverflow: Linux “free -m”: Total, used and free memory values don’t add up. Essentially, free does not show the “+/- buffers/cache” line anymore, but instead shows an “available” column which is taken from the MemAvailable metric which has been introduced with kernel 3.14. See https://www.kernel.org/doc/Documentation/filesystems/proc.txt for a complete description:

MemAvailable: An estimate of how much memory is available for starting new applications, without swapping. Calculated from MemFree, SReclaimable, the size of the file LRU lists, and the low watermarks in each zone. The estimate takes into account that the system needs some page cache to function well, and that not all reclaimable slab will be reclaimable, due to items being in use. The impact of those factors will vary from system to system.
The new format of the free output looks like this:

The main difference is that the “buff/cache” values are not part of “Used” anymore, but counted separately. Hence, the total memory is calculated as “used + buff/cache + free”:

Since the “available” value is an estimation which considers some system specific factors, it can not directly be calculated from the other values which are shown by free.
Defining a custom core file handler

I recently was wondering how apport can intercept core files written by the Linux kernel. Essentially, there is a kernel interface which allows to execute arbitrary commands whenever the kernel generates a core file. Earlier, this was used to fine tune the filename of the core file, like adding a time stamp or the user id of the process which generated the core file, instead of just plain core. The file name pattern can be defined through a special file located at /proc/sys/kernel/core_pattern. Since kernel 2.6.19, /proc/sys/kernel/core_pattern also supports a pipe mechanism. This allows to send the whole core file to stdin of an arbitrary program which can then further handle the core file generation. Additional parameters like the process id can be passed to the command line arguments of the program by using percent specifiers. On Ubuntu, by default /proc/sys/kernel/core_pattern contains the following string:

|/usr/share/apport/apport %p %s %c %P

This means to send the core file to stdin of /usr/share/apport/apport, and pass additional parameters like the process id to the command line parameters. See https://man7.org/linux/man-pages/man5/core.5.html for more information about the supported % specifiers.

Example: automatically launching a debugger

It is also possible to execute a shell script, which makes it very easy to execute specific actions whenever a core file is generated. Lets assume we want to launch the gdb debugger each time a core file is created, load the crashed program together with the core file and automatically show the call stack where the program crashed. This can be achieved by the following script:

#!/bin/bash

# Get parameters passed from the kernel
EXE=`echo $1 | sed -e "s,!,/,g"`
EXEWD=`dirname ${EXE}`
TSTAMP=$8

# Read core file from stdin
COREFILE=/tmp/core_${TSTAMP}
cat > ${COREFILE}

# Launch xterm with debugger session
xterm -display :1 -e "gdb ${EXE} -c ${COREFILE} -ex \"where\"" &

Now, all we need to do is to register the script in /proc/sys/kernel/core_pattern (we need to do this as root, of course). Assumed that the script is stored as /tmp/handler.sh, we can use the following command to have the kernel execute it whenever a core file is to be written:

# echo '|/tmp/handler.sh %E %p %s %c %P %u %g %t %h %e' > /proc/sys/kernel/core_pattern

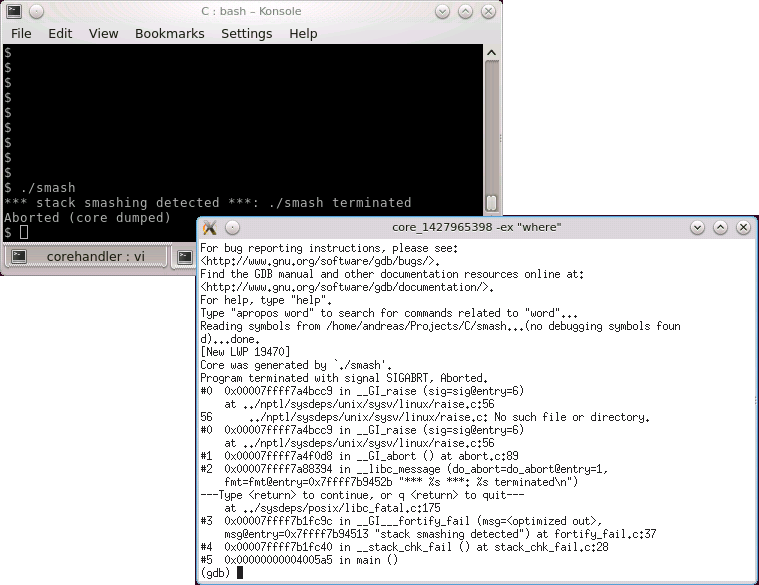
Fsor the script above, we would only need the %E and %t specifiers, but by passing all available parameters we can adjust the script without the need to modify /proc/sys/kernel/core_pattern when additional parameters are required. From now on, whenever a core dump is generated, an xterm window will open, gdb will be launched, the crashed file together with the core dump will be loaded into the debugger and the where command will be executed to show the call stack up to the location where the program crashed. The following screenshot shows the execution of the stack smashing sample I wrote about earlier.

Note: the xterm and all programs within it will be run as root user, so be careful with what you do inside the xterm!

The GS segment and stack smashing protection

When disassembling (32 bit i386 / x86) code on Linux, we sometimes come across instructions like

...
call   *%gs:0x10
...
movl    %gs:0x14, %eax
...

Here, gs refers to the Thread Control Block (TCB) header which stores per-CPU and thread local data (Thread Local Storage, TLS). The Thread Control Block header is a structure which is defined in the C library, for example in eglibc-2.19/nptl/sysdeps/i386/tls.h (slightly simplified and added the gs segment offsets):

typedef struct {
  void *tcb;              /* gs:0x00 Pointer to the TCB. */
  dtv_t *dtv;             /* gs:0x04 */
  void *self;             /* gs:0x08 Pointer to the thread descriptor.  */
  int multiple_threads;   /* gs:0x0c */
  uintptr_t sysinfo;      /* gs:0x10 Syscall interface */
  uintptr_t stack_guard;  /* gs:0x14 Random value used for stack protection */
  uintptr_t pointer_guard;/* gs:0x18 Random value used for pointer protection */
  int gscope_flag;        /* gs:0x1c */
  int private_futex;      /* gs:0x20 */
  void *__private_tm[4];  /* gs:0x24 Reservation of some values for the TM ABI.  */
  void *__private_ss;     /* gs:0x34 GCC split stack support.  */
} tcbhead_t;

Lets take a closer look at gs:0x10 which I mentioned above: The stack_guard member contains a random value which is used to protect against stack smashing – consider the following sample which contains an obvious buffer overflow:

#include <string.h>

int main() {
   char buffer[4];
   strcpy(buffer, "Hello World");
   return 0;
}

When we compile and run this application, we will get a runtime error:

$ gcc -m32 -o smash smash.c
$ ./smash 
*** stack smashing detected ***: ./smash terminated
Aborted (core dumped)

Lets look at the code which is generated by the compiler:

$ gcc -m32 -S -o smash.S smash.c

The following is the (simplified and commented) smash.S file:

main:
; Set up the stack
        pushl   %ebp
        movl    %esp, %ebp
        andl    $-16, %esp
        subl    $16, %esp

; Set up stack guard
        movl    %gs:20, %eax       ; load random value
        movl    %eax, 12(%esp)     ; store value as a guard variable 
        xorl    %eax, %eax         ; make sure that noone can read the random value afterwards
;...
; strcpy ommitted (this overwrites 12(%esp) since the string is too large for the buffer)
;...

; Check stack guard against value from TCB
        movl    12(%esp), %edx     ; load previously stored value from stack
        xorl    %gs:20, %edx       ; check if still the same
        je      .L3                ; yes, then fine
        call    __stack_chk_fail   ; print error message and abort()
.L3:
        leave
        ret

As we see, the compiler inserts instructions at the beginning of the function to set up the stack guard variable, and it inserts instructions at the end of the function to check if the value has changed meanwhile (means, if any code within the function has written beyond the area allocated for local variables and hence has potentially overwritten the return address for the current function). The generation of the stack protection code can be disabled by passing the -fno-stack-protector option to gcc – this is something which should, of course, normally not be done but it can sometimes be useful in order to analyze certain security issues.

Returning values from a bash function

bash does not provide a return statement to return custom values from a function. The return statement is only used to return a numeric status code to the calling function which can be retrieved with $?. Long story made short, use a recent bash version (>= 4.3) and use the declare -n statement to declare a reference to the variable where the result will be stored, and pass the name of this variable as a parameter to the function:

#!/bin/bash

someFunction() {
    declare -n __resultVar=$1
    local someValue="Hello World"

    # The next statement assigns the value of the local variable to the variable
    # passed as parameter
    __resultVar=${someValue}
}

# call the function and pass the name of the result variable
someFunction theResult
echo ${theResult}